Source: https://github.com/mcdonohue/mdonohue/tree/main/posts/predicting-inevitable
Plasma markers of phosphorylated tau-217 (such as %p-tau217) have rapidly emerged as a robust marker of underlying Alzheimer’s Disease (AD) pathology.1 Building on this excitement, recent work has focused on longitudinal measurements of plasma p-tau217, with this work suggesting significant change over time in at risk groups,2 although with milder associations with concurrent cognitive changes.3
The article by Petersen et al.4 expands in this direction by applying disease clock models (Sampled Iterative Local Approximation [SILA]5 and Temporal Integration of Rate Accumulation [TIRA]6) to derive estimates of the age at plasma %p-tau217 positivity, based on estimation of group level accumulation combined with individual level %p-tau217 magnitude. This measure of age at %p-tau217 positivity, defined as baseline age minus the estimated time from %p-tau217 positivity is then used to claim prediction of the age at onset of symptomatic (AD). We show that this apparent predictive performance is largely artifactual, arising from two structural features of the analysis: (1) restriction to individuals who progressed to symptomatic AD during limited follow-up, which induces a strong artifactual association between baseline age and age at onset, and (2) the use of constructed predictors and outcomes that share age and timing components, making the resulting associations partly self-referential. Using digitized data from the published figures, we decomposed the clock-derived measure into baseline age and estimated time from plasma %p-tau217 positivity, quantified shared and unique explained variance using commonality analysis, and evaluated a null scenario by replacing the biomarker component of the clock measure with a randomly generated time from %p-tau217 positivity, drawn over the observed range. This randomization preserves the scale and support of the predictor while removing any biomarker information, allowing the contribution of structural relationships to be assessed directly. In ADNI, baseline age alone explained substantially more variance in age at onset than the reported plasma %p-tau217 clock-derived predictors (\(R^2\approx0.78\) versus \(0.337\) and \(0.470\) for TIRA and SILA), the estimated time from %p-tau217 component contributed little additional information, and randomly generated values produced qualitatively similar associations (\(R^2\approx0.79\)). These results indicate that the reported predictive performance of the plasma %p-tau217 clock is driven largely by structural age relationships rather than independent biomarker information.
The primary analysis links estimated age at %p-tau217 positivity to observed age at symptom onset in individuals who were known to progress and forms one of the central results of the paper. However, this analysis evaluates when progression occurs in a sample restricted to individuals who progress within a limited follow-up window—a substantially less clinically relevant problem than predicting onset in an all-comers population, which represents a key goal in the field. In the restricted sample, baseline age must precede age at symptom onset, and the interval between them is bounded by the observation period of the study. As a result, baseline age alone strongly predicts age at onset, even in the absence of biomarker information.
This structure carries directly into the clock-based analysis, where age at onset is regressed on estimated age at p-tau positivity. Because the plasma %p-tau217 clock combines baseline age with an estimated timing component, and the outcome is itself constrained by baseline age, the resulting association reflects a mixture of structural age relationships and any true biomarker signal. To separate these components, the clock can be decomposed into baseline age and estimated time from p-tau positivity, and age at onset modeled as a function of both terms, allowing the independent contribution of the biomarker timing component to be assessed.
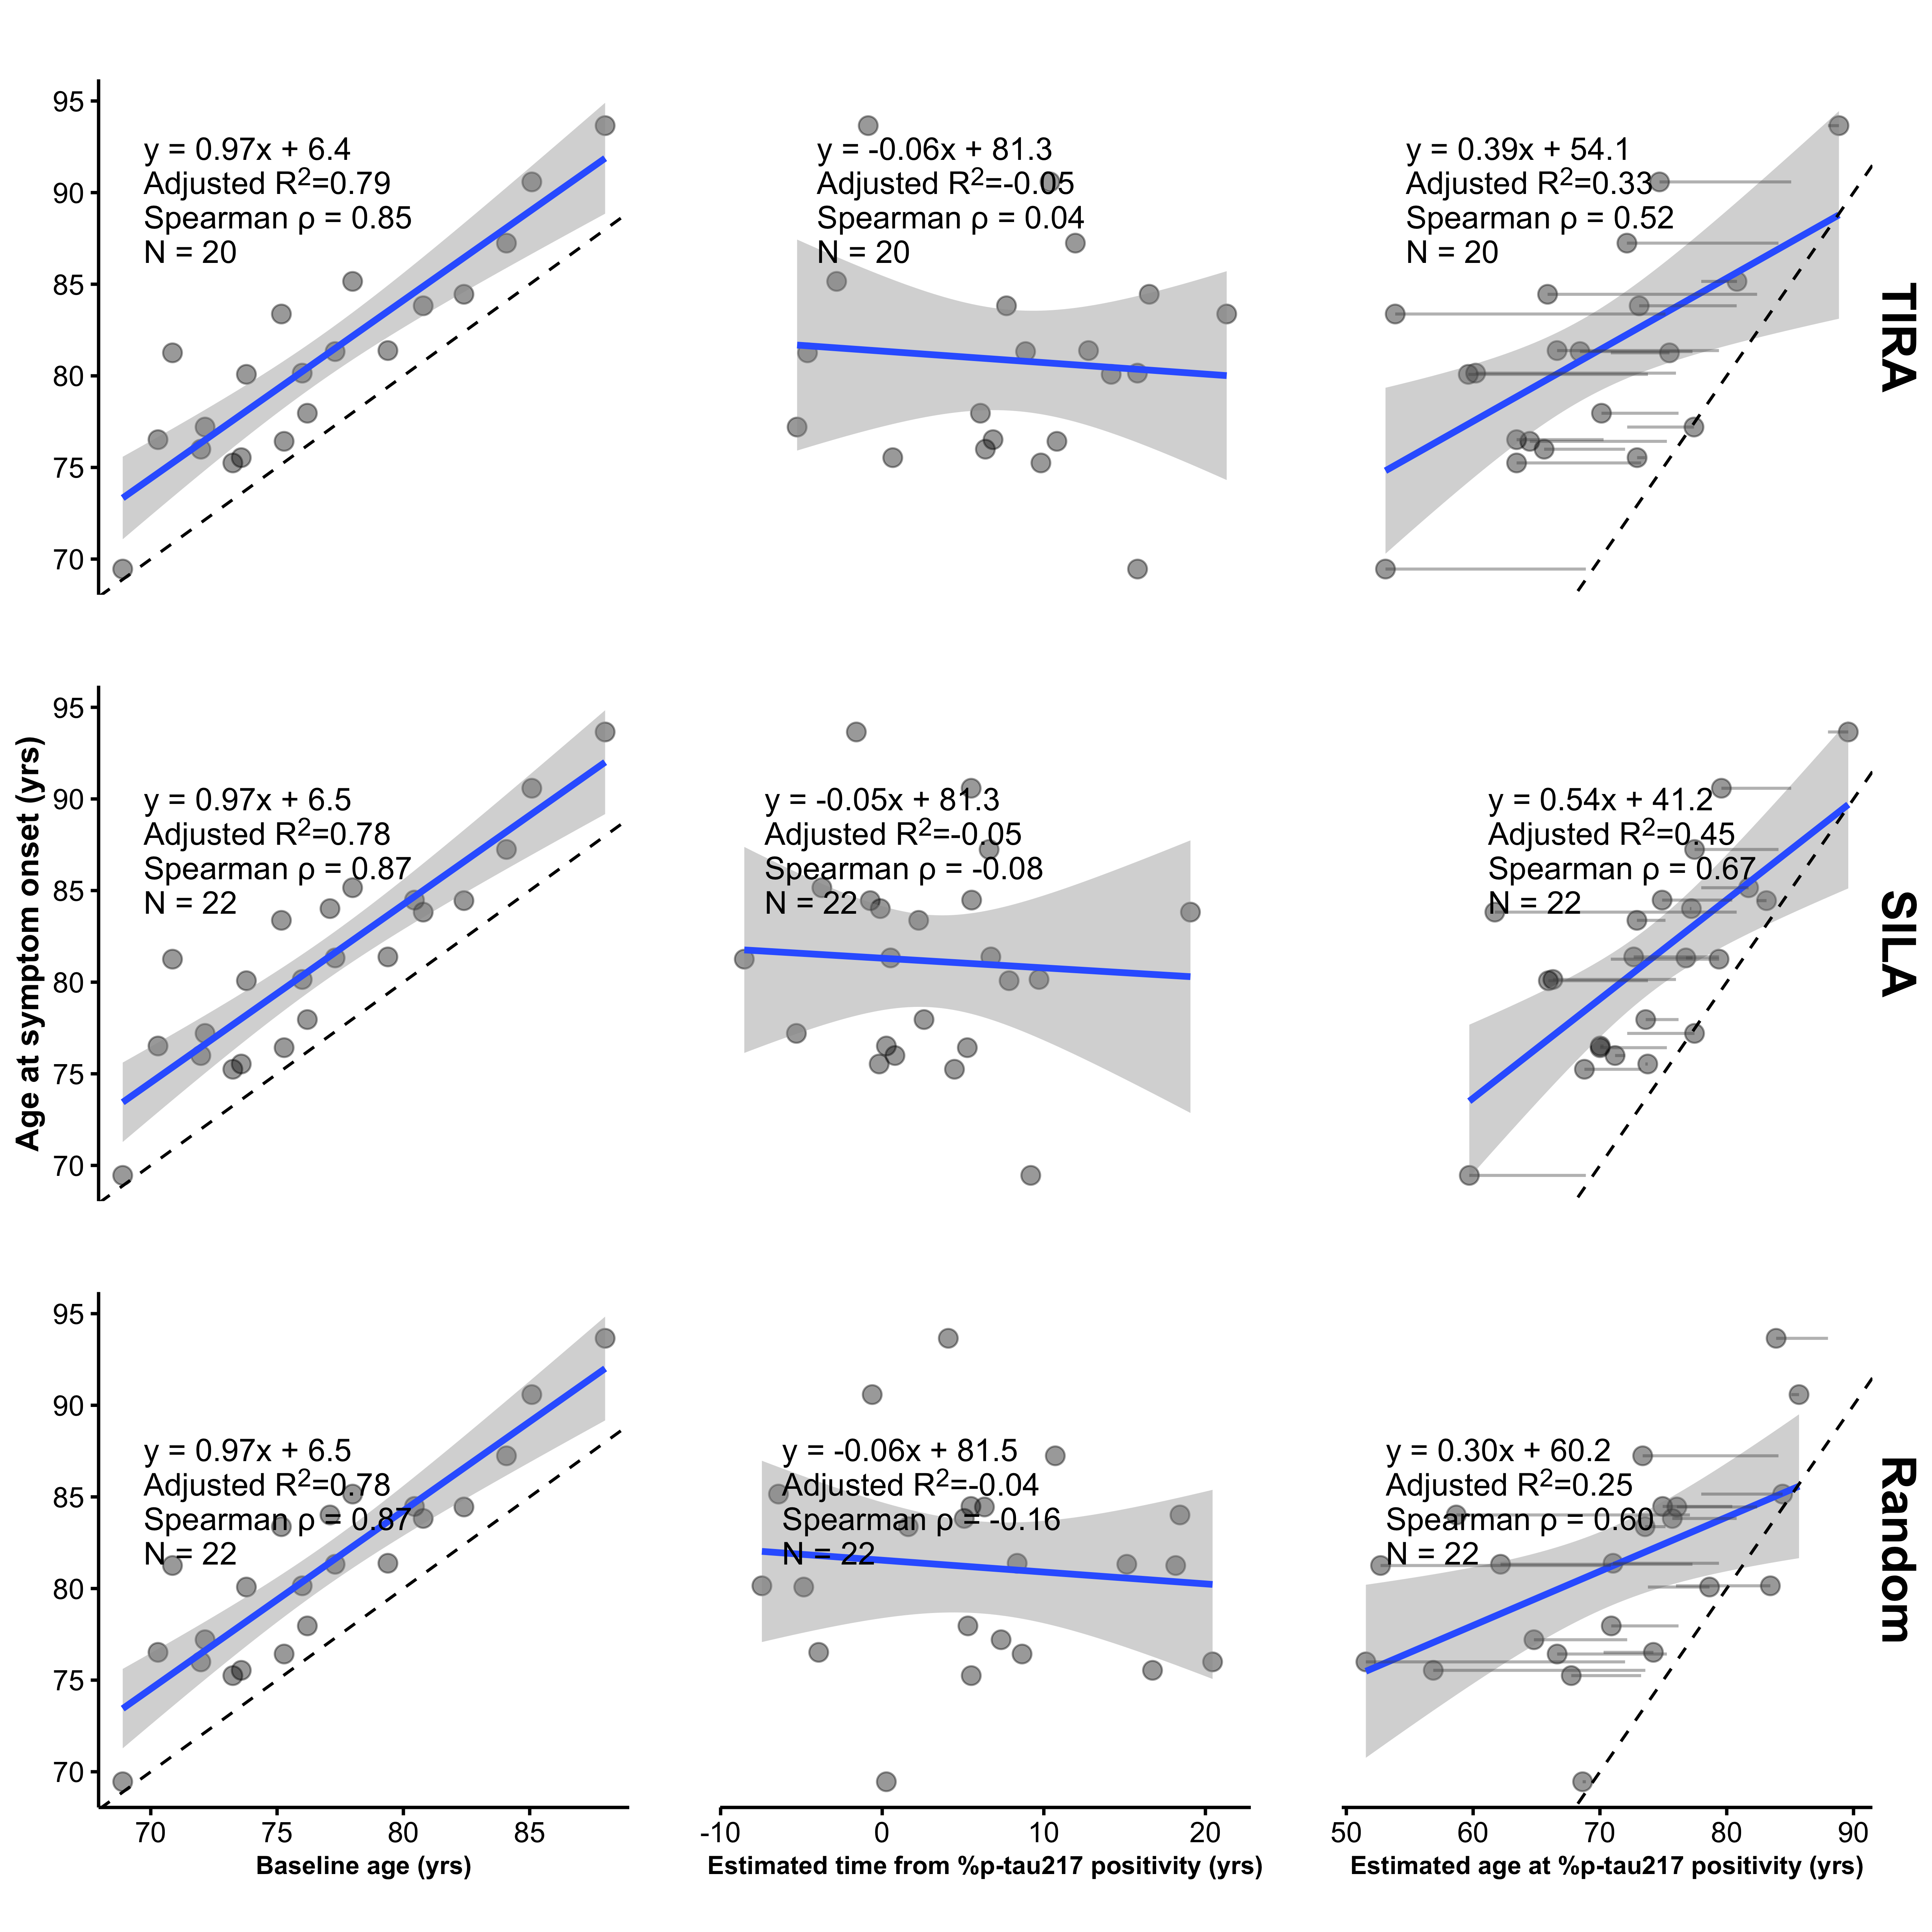
In their Alzforum response to this critique,7 the authors confirmed that in ADNI, baseline age alone predicts age at symptom onset with an \(R^2\) of approximately 0.78 (Figure 1, top left). In contrast, the estimated age of %p-tau217 positivity achieves substantially lower \(R^2\) values (0.337 and 0.470 for TIRA and SILA, respectively; Figure 4 in Petersen et al.4 and Figure 1, right panels). Thus, incorporating the biomarker-derived estimate does not improve explained variance relative to baseline age alone, but instead reduces it. Consistent with this, the estimated time from p-tau positivity shows little association with age at onset, and adding it to baseline age does not improve model fit (Figure 1). Patterns obtained using a randomly generated time from p-tau positivity, drawn uniformly over the observed range, are qualitatively similar to those obtained using the SILA and TIRA estimates (Figure 1, bottom).
To further quantify these relationships, Table 1 presents a commonality analysis8 partitioning the unique and shared variance between baseline age and the estimated age of p-tau positivity (via SILA, TIRA, or the random comparator) as predictors of age at onset. While a substantial proportion of explained variance is shared between predictors (50% for SILA; 42% for TIRA; 36% for random), the unique contributions differ markedly. Baseline age independently accounts for a large proportion of the variance (44% for SILA; 56% for TIRA; 64% for random), whereas the estimated age of p-tau positivity contributes minimally (6% for SILA; 3% for TIRA; 0.07% for random). These results indicate that nearly all explained variance is either shared with or uniquely attributable to baseline age, with little additional contribution, only 3% to 6%, from the biomarker-derived timing component.
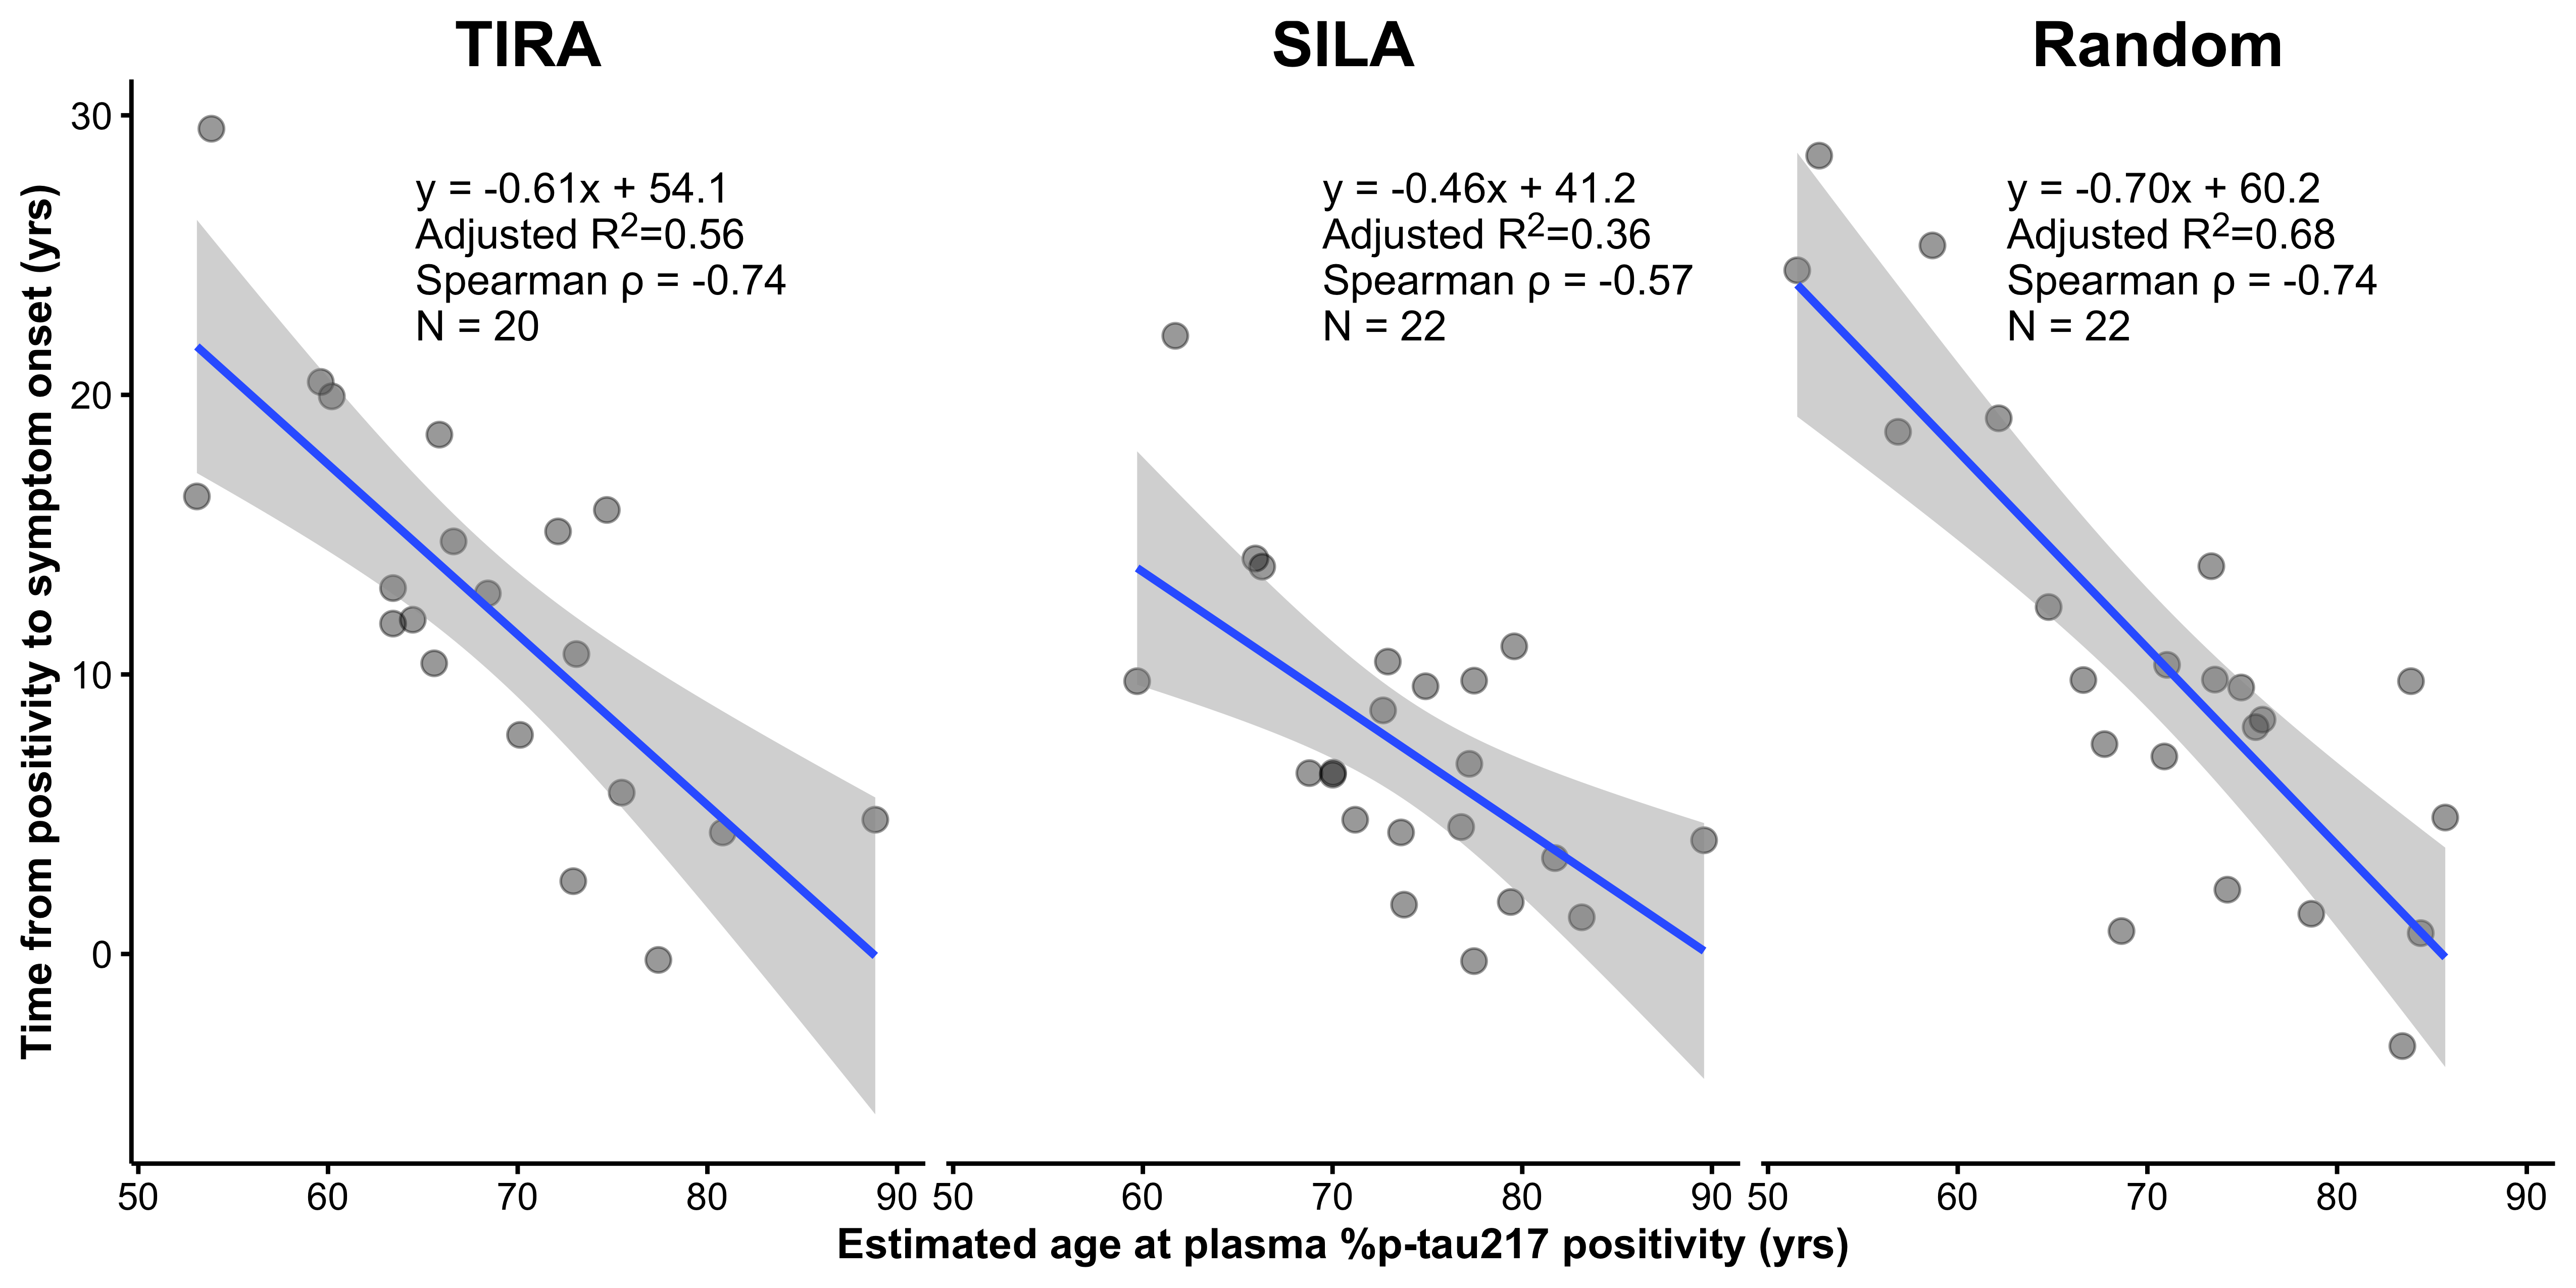
The authors have also highlighted analyses that exclude age from the outcome. In Supplementary Figure 6, the analysis is framed as regressing time from %p-tau217 positivity to symptom onset (\(T_{\mathrm{pos}\rightarrow\mathrm{onset}}\)) on the estimated age at positivity (\(A_{\mathrm{pos}}\)). The outcome is equivalently to the difference between age at onset and age at positivity: \[ T_{\mathrm{pos}\rightarrow\mathrm{onset}} = A_{\mathrm{onset}} − A_{\mathrm{pos}} \] The predictor, estimated age at positivity, is defined as age at baseline minus time from p-tau positivity \[ A_{\mathrm{pos}} = A_{\mathrm{baseline}} − T_{\mathrm{pos}} \] The linear regression analysis in Supplementary Figure 6 becomes: \[ (A_{\mathrm{onset}} − A_{\mathrm{pos}}) = (A_{\mathrm{baseline}} − T_{\mathrm{pos}}) + \mathrm{error} \] The first component of the outcome, \(A_{\mathrm{onset}}\), is artifactually associated with the first component in the predictor, \(A_{\mathrm{baseline}}\), as demonstrated in the previous analysis. The second component of the outcome, \(A_{\mathrm{pos}}\), is the predictor. Thus, all terms in the outcome are either defined by, or artifactually associated with, the predictor. It follows that the analysis in Supplementary Fig. 6 does not remove the structural problem in Figure 4; it inherits the same dependence on shared components under constrained follow-up.
In our analysis, when the estimated age of %p-tau217 positivity is replaced with age at baseline minus the randomly generated time from %p-tau217 positivity, the \(R^2\) increases from 0.57 (TIRA) or 0.39 (SILA) to 0.68 (random). This shows that the magnitude of the association in Supplementary Fig. 6 can be reproduced using a predictor that contains no biomarker information, indicating that the observed relationship is driven by the structural dependence of the outcome on the predictor, rather than by the clock-estimated time to p-tau positivity.
SILA | TIRA | Random | ||||
|---|---|---|---|---|---|---|
Effect |
| % Total |
| % Total |
| % Total |
Unique to baseline age | 0.37 | 43.78 | 0.46 | 55.75 | 0.51 | 64.37 |
Unique to age of %ptau217 positivity | 0.05 | 6.07 | 0.02 | 2.63 | 0.00 | 0.07 |
Common to both | 0.42 | 50.15 | 0.34 | 41.62 | 0.28 | 35.56 |
Total | 0.84 | 100.00 | 0.82 | 100.00 | 0.79 | 100.00 |
Adj. | 0.83 | 0.80 | 0.77 | |||
This methodological objection is not intended to dismiss the significance of plasma p-tau217 as a predictor. Indeed, we and others have found it to be a robust predictor of cognitive decline in cognitively unimpaired populations. And not all analyses in Petersen et al. are subject to the structural issues described above. For example, their survival analyses include both progressors and non-progressors and therefore avoid the selection-induced artifact. These analyses yield more modest effect sizes, consistent with prior work showing that plasma p-tau217 is associated with subsequent cognitive decline, but with limited precision at the individual level, especially when incorporating plasma p-tau217 changes over time.3 In this same sample of \(N=1,629\) cognitively unimpaired (median follow-up six years), a model incorporating baseline p-tau217, hippocampal atrophy, amyloid PET, APOE \(\epsilon4\) status, and demographics achieved a cross-validated area under the precision–recall curve (AUPRC) of approximately 70% for discriminating clinical decline from stability.10
Notably, 77% of the 1,629 cognitively unimpaired individuals in this cohort remained cognitively stable throughout follow-up. While accuracy metrics can be inflated by focusing only on individuals who decline (a small minority) and ignoring the stable majority, such an approach does not reflect the clinical reality of population screening. Given the clear clinical potential of plasma measures of AD (cite), and the availability of direct to consumer ptau-217 measurements, it is critical that scientific research evaluating these tools portrays an accurate representation of what these measurements can and cannot provide. Rather than assuming that all individuals are on a common declining trajectory, the latent class approach we employed explicitly estimates the probability that an individual will be a progressor.11 It is clinically imperative to convey the degree of certainty regarding an individual’s trajectory before counseling them on their “clock” under an unsupported assumption of inevitable decline.
Notably, 77% of this cohort remained cognitively stable throughout the follow-up. While accuracy metrics could be artificially inflated, albeit impractically, by focusing solely on the minority of decliners and ignoring the stable majority, such an approach ignores the clinical reality of population screening. Rather than assuming everyone is on the same declining trajectory, the latent class approach we employed explicitly estimates the likelihood that an individual will be a progressor or not.11 It is clinically imperative to convey the degree of certainty regarding an individual’s trajectory before counseling them on their “clock” under an unsupported assumption that they are doomed to dementia.
References
1.
Warmenhoven N, Salvadó G, Janelidze S, et al. A comprehensive head-to-head comparison of key plasma phosphorylated tau 217 biomarker tests. Brain. 2025;148(2):416-431.
2.
Mattsson-Carlgren N, Janelidze S, Palmqvist S, et al. Longitudinal plasma p-tau217 is increased in early stages of Alzheimer’s disease. Brain. 2020;143(11):3234-3241.
3.
Insel PS, Mattsson-Carlgren N, Langford O, et al. Concurrent changes in plasma phosphorylated tau 217, tau PET, and cognition in preclinical Alzheimer disease. JAMA Neurology. 2025;82(10):985-993.
4.
Petersen KK, Milà-Alomà M, Li Y, et al. Predicting onset of symptomatic Alzheimerʼs disease with plasma p-tau217 clocks. Nature Medicine. Published online 2026. doi:10.1038/s41591-026-04206-y
5.
Betthauser TJ, Bilgel M, Koscik RL, et al. Multi-method investigation of factors influencing amyloid onset and impairment in three cohorts. Brain. 2022;145(11):4065-4079.
6.
Schindler SE, Li Y, Buckles VD, et al. Predicting symptom onset in sporadic Alzheimer disease with amyloid PET. Neurology. 2021;97(18):e1823-e1834.
7.
Not if, but when: Blood p-Tau217 clock tells time of AD onset. 2025. https://www.alzforum.org/news/research-news/not-if-when-blood-p-tau217-clock-tells-time-ad-onset#comment-57821
8.
Nimon K, Lewis M, Kane R, Haynes RM. An R package to compute commonality coefficients in the multiple regression case: An introduction to the package and a practical example. Behavior research methods. 2008;40(2):457-466.
9.
Rohatgi A. WebPlotDigitizer. https://automeris.io
10.
Li R, Langford O, Insel PS, et al. Divergent patterns of cognitive decline in preclinical Alzheimer’s disease: Implications for secondary prevention trials. Alzheimer’s & Dementia. Published online In press. doi:10.64898/2025.12.15.25342305
11.
Proust-Lima C, Philipps V, Liquet B. Estimation of extended mixed models using latent classes and latent processes: the R package lcmm. Journal of Statistical Software. 2017;78:1-56.